
DEPRIMAP Presents New Insights on Urban Deprivation at JURSE 2025
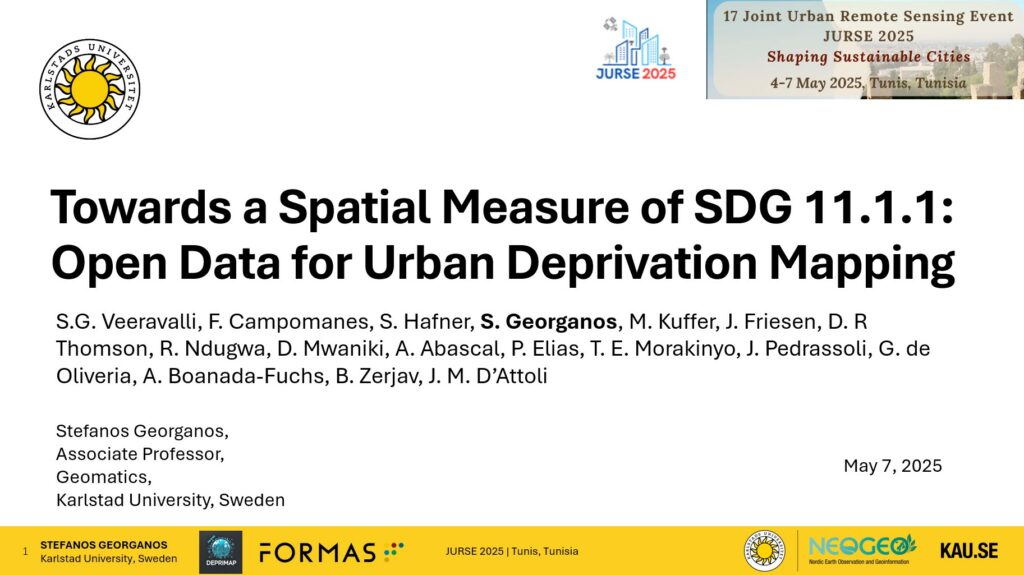
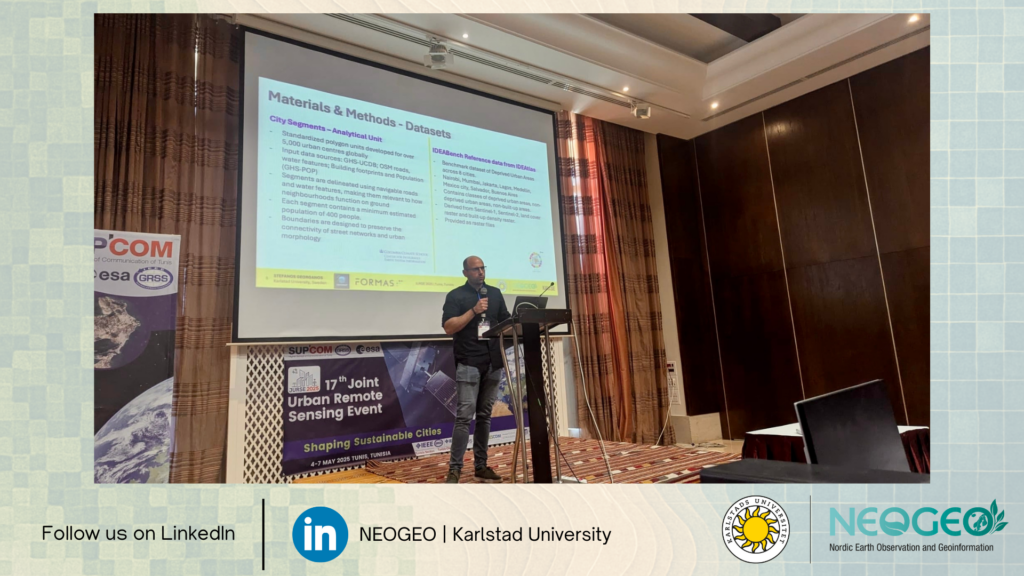
From May 4-7, 2025, the city of Tunis, Tunisia, hosted the Joint Urban Remote Sensing (JURSE), a key conference that brings together experts working at the intersection of remote sensing, urban studies, and spatial analysis. Representing DEPRIMAP, Dr. Stefanos Georganos presented our latest research titled ‘Towards a Spatial Measure of SDG 11.1.1: Open Data for Urban Deprivation Mapping‘.
Authors: S.G. Veeravalli, F. Campomanes, S. Hafner, S. Georganos, M. Kuffer, J. Friesen, D. R Thomson, R. Ndugwa, D. Mwaniki, A. Abascal, P. Elias, T. E. Morakinyo, J. Pedrassoli, G. de Oliveria, A. Boanada-Fuchs, B. Zerjav, J. M. D’Attoli
This work builds on collaborative efforts initiated during the October 2024 Workshop in St. Gallen, Switzerland, which focused on scalable approaches to identify and monitor deprived urban areas (DUAs) across the Global South. The JURSE platform offered a valuable opportunity to present our approach to a wider audience and to share new findings that advance the spatial monitoring of SDG 11.1.1, which targets access to adequate, safe, and affordable housing for all.
🛰️ Mapping Deprivation with Open Data: Key Insights from the Study
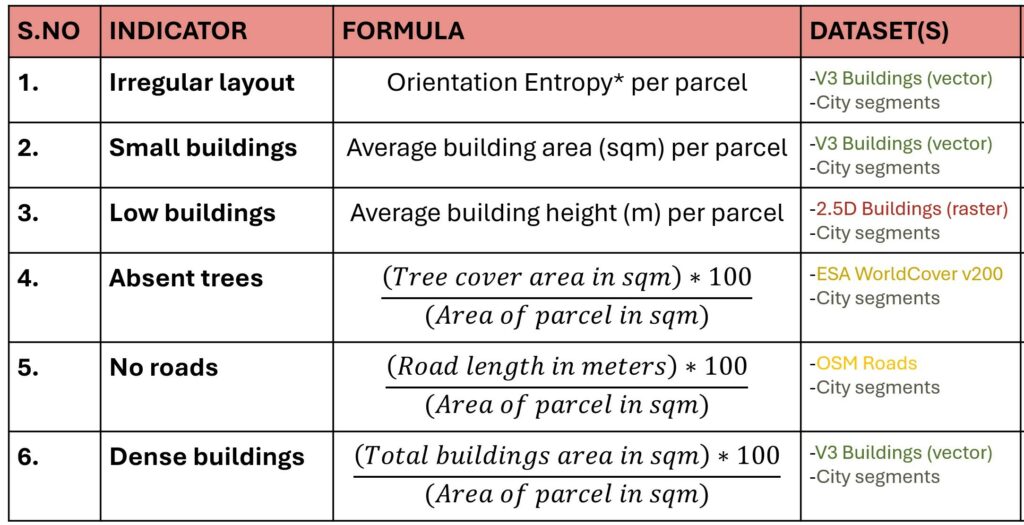
At the heart of the study is a geospatial framework designed to assess urban deprivation by operationalising a set of indicators tied to ‘unplanned urbanization’, and ‘infrastruture’ domains of the domains of deprivation framework. Using open and globally available datasets including Google Open Buildings 2.5D dataset, Google Open Buildings V3 dataset, ESA WorldCover v200, and OpenStreetMap roads, the framework computes a composite derivation score across standardised city segments. Each segment is evaluated on six indicators:
- Irregular building layout
- Small building size
- Low building height
- Absence of trees
- Low road density
- High building density
These indicators are binarised based on global median or mean thresholds, with each segment assigned a deprivation score ranging from 0 to 6. The framework was first tested in Nairobi, using reference DUA boundaries from the IDEAtlas and IDEAMAPS Network to validate the results. Scores of 4 and above showed strong spatial correspondence with known informal settlement areas, especially in neighbourhoods like Kibera, Mathare, and Kariobangi.
The JURSE presentation extended this analysis with cross-city validation using the IDEABench dataset, covering seven additional cities: Mumbai, Jakarta, Lagos, Medellin, Mexico City, Salvador, and Buenos Aires. The broader analysis revealed:
- Strong performance in Mumbai and Nairobi.
- Building size and tree density were among the most reliable global indicators.
- Low accuracy from indicators like road density and building orientation, especially in African cities.
- Minimal performance differences between median- and mean-based thresholding.
Together, these results emphasise the growing potential of scalable, open-data-driven methods for deprivation mapping.
While our current framework provides a robust starting point, we aim to improve:
- By incorporating additional indicators in ‘unplanned urbanization’, ‘infrastructure’ domains and bringing in the ‘Facilities & services’ domain indicators as well.
- Explore alternative threshold methods moving beyond global medians to better adapt to regional variations.
📝 The conference proceedings full paper will be shared once it is online: https://ieeexplore.ieee.org/document/11076033
S. G. Veeravalli et al., “Towards a Spatial Measure of SDG 11.1.1: Open Data for Urban Deprivation Mapping,” 2025 Joint Urban Remote Sensing Event (JURSE), Tunis, Tunisia, 2025, pp. 1-4, doi: 10.1109/JURSE60372.2025.11076033.
🌍 Why this matters
Urban deprivation is a complex, multidimensional challenge, especially in fast-growing cities where conventional data is scarce or outdated. The DEPRIMAP approach demonstrates that it is possible to:
- Use freely available geospatial and remote sensing data to produce meaningful deprivation indicators.
- Validate findings across cities and regions with diverse urban forms, and
- Support global SDG monitoring efforts with spatially explicit, scalable tools.
The findings presented at JURSE reinforce our commitment to building open, interpretable, and flexible frameworks for identifying deprived urban areas. This work contributes directly to the broader goals of the IDEAMAPS community and to ongoing conversations about how urban informality is measured, visualised, and addressed in policy.
🌐 What’s Next?
At the end of this month, DEPRIMAP team members will present at the 8th EARSeL Workshop on Earth Observation in the Global South in Prague, where we will showcase another stream of work, this time focusing on urban change detection in informal settlements using time-series data from Google’s 2.5D building dataset and validation through Google Street View and Google Earth Pro.
Closing Note
We extend our sincere thanks to the JURSE 2025 organisers and the vibrant community of scholars who shared their insights and feedback during the event. The presentation in Tunisia was not just a milestone for this study, it was a step forward in DEPRIMAP’s broader mission: to map deprivation more accurately, more inclusively, and at the scale the problem demands.
Stay tuned for upcoming publications, tools, datasets, and collaboration opportunities.
Some glimpses from the JURSE2025 conference: Link
No responses yet