A picture is worth a thousand words. Make a simple overview picture that presents what will happen during the course.
Problem
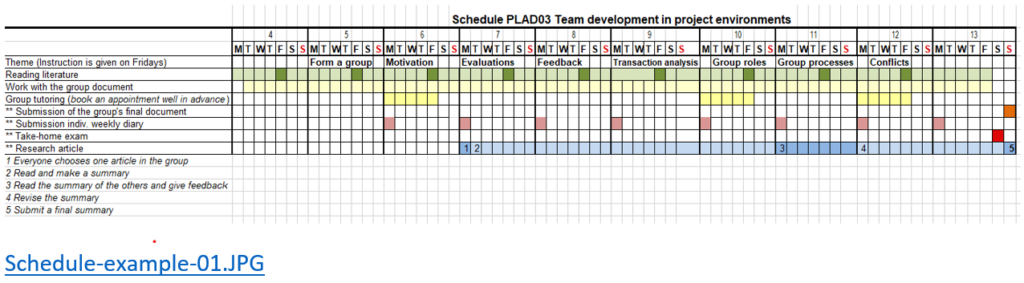
Students get a poor overview of the course flow and are overwhelmed by all the fragmentary information about lesson sessions, deadlines, reading, tutoring. “How should I plan my time?” “Am I too fast or am I sliding behind?” “Help!“
Solution
A simple overview image can help a lot. In the example below, the entire course time-line has been summarized from left to right. Each line indicates a type of planned work, important milestones and deadlines, such as submissions and examinations. Different colors mark different kinds of activities to enhance the overall impression.
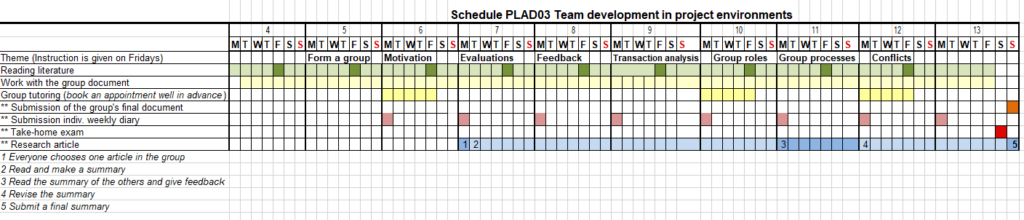
The example image is made in Excel and cut directly from the screen with the Screenshot tool and saved as an jpg image. Click on the image to open in larger size.
Here you can download the example in excel format and use as a basis when preparing one for your own course (Note that the example is in Swedish, but will of course also work nicely as template for a course in English!):
Present the image in Canvas
The image can e. g. be inserted on the home page in the Canvas course website:
Insert the image and mark it as “Embed Image” (Then it will appear much like you see it above, but unfortunately you can not click on it to enlarge it).
Therefore, insert the same image again, directly below the first one, but now mark as “Display Text Link (Open in a new tab)” (This will display a link that students can use to open it in large format in a new tab).
You make the settings when you insert the image.
This is what it looks like on the canvas page when done as in the instructions above. Notice the link directly below the image.